
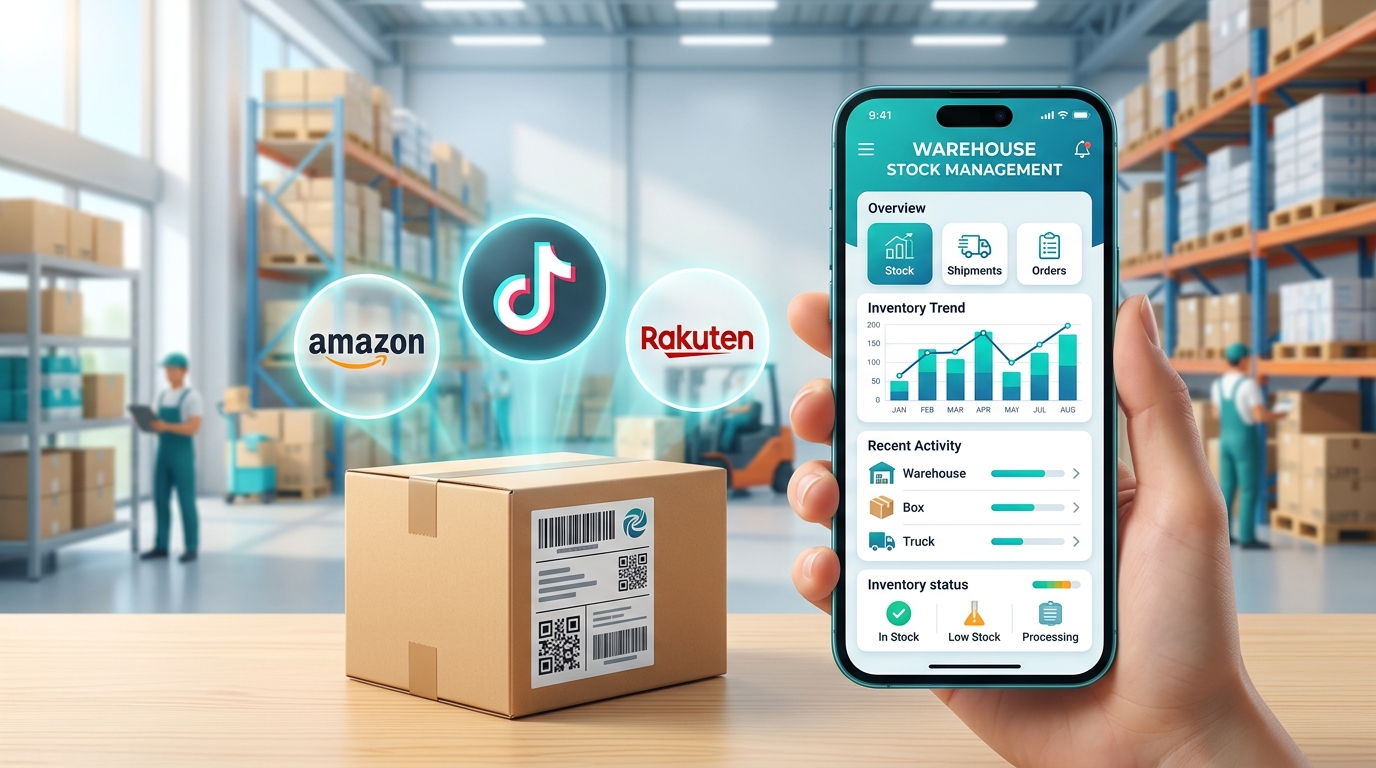
Direct Answer: Effective e-commerce logistics require data-driven visibility. DONOMI's logistics dashboard, built with Next.js and Recharts, visualizes inbound/outbound transactions, inventory levels, and delivery performance in real time. This interactive dashboard enables early detection of anomalies, trend analysis, and enhanced operational transparency. Powered by Cloudflare's infrastructure, it delivers high-speed data processing and robust multilingual support, making it an ideal solution for managing complex, global fulfillment operations efficiently.
Designing a Multi-Platform Order Management System (OMS)
When selling across Amazon, Rakuten, TikTok Shop, and other platforms, unified order management becomes critical.
Why You Need an OMS
- Centralized orders: View all platform orders in a single dashboard
- Auto inventory sync: Automatically deduct stock across platforms when items sell
- Shipping efficiency: Batch label creation and automatic tracking integration
- Profit visibility: Real-time sales and profit analysis by platform
Architecture Design
Data flow:
Platform APIs → OMS Central DB → Shipping Management → Carrier APIs
Tech stack:
- Frontend: Next.js + React
- Backend: Node.js / Python
- Database: Cloudflare D1 / PostgreSQL
- Queue: Cloudflare Queues
Platform-Specific Challenges
| Platform | API Type | Key Considerations |
|---|---|---|
| Amazon | SP-API | Complex auth, rate limits |
| Rakuten | RMS API | XML-based, update frequency |
| TikTok Shop | Open API | Relatively new, frequent changes |
DONOMI's Implementation
DONOMI operates a custom-built OMS that efficiently processes orders across multiple platforms.
Q: What are the main features of the logistics dashboard?
It visualizes real-time inventory levels, inbound/outbound order volumes, and delivery performance metrics using interactive charts.
Q: What technology stack is used for the dashboard?
The dashboard is built using Next.js for the frontend, Recharts for data visualization, and Cloudflare's infrastructure for the backend.
Q: What are the benefits of data visualization in logistics?
It allows for quick identification of trends and anomalies, enabling faster, data-driven decisions to optimize operations.